This is the third of a series of LinkedIn posts where Stampa & Partners answers the question: “How efficiently can you track the profitability and cost management of your services and operations?”. Previous posts are available in our Blog and LinkedIn pages.

In previous post we present a scenario of company MS which started a cost monitoring program. This program impacts on the cost allocation of worldwide offices by influencing its drivers. MS adopted PAPM for its speed, reliability and flexibility.
Process
⇒ Phase 1 – Adding and aggregating units
SAP PAPM contains a broad set of functions that can be used for different purposes. This allows the user to build a scenario from scratch, define the allocation drivers and analyse the results at the end of each round.
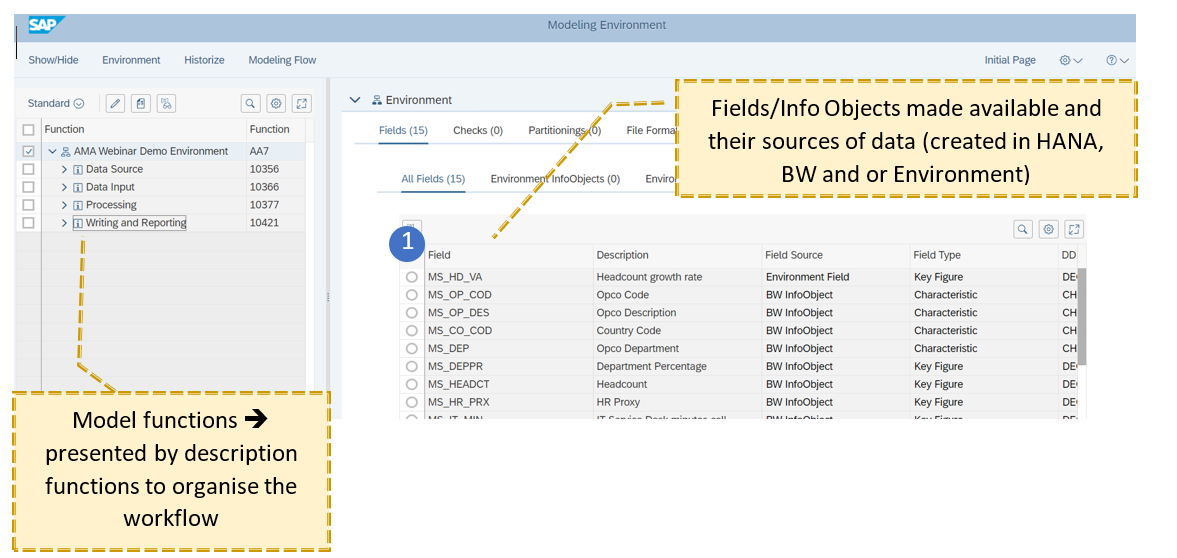
When starting PAPM, MS can access the modelling environment as well as to the defined processes, activities and reports. In this case study only the first is presented.
Main steps were followed:
- MS defined the info objects in HANA (in alternative MS could have done it directly in the Environment):

- Data sources were received from the 4 Main Offices (reported by the 43 local offices) and financial data on cost to be allocated from the Headquarters;
- MS aggregated all the sources (info from Offices) and drivers (info from HQ) using a join function (i.e. Op. and Drivers Cross Info);
- MS transform the resulting table into a Model BW using a writer function and use the result as an input query for reporting purposes (i.e. Initial Input Query):

Please stay connected to access next week’s third part of our Cost allocation / monitoring program Case Study.
We at Stampa & Partners have an extensive track record working with CFOs and supporting organisations in Europe successfully digitalise finance functions, leverage analytics and ensure compliance with new accounting standards. Therefore, we can advise your business with the best solutions to fulfil your goals.
By André Almeida