This is the fourth of a series of LinkedIn posts where Stampa & Partners answers the question: “How efficiently can you track the profitability and cost management of your services and operations?”. Previous posts are available in our Blog and LinkedIn pages.

In previous post we present the first phase of the process to setup MS’s HQ cost allocation, i.e. adding and aggregating units. In this post we will cover the second phase, processing inputs.
Process
⇒ Phase 2 – Processing inputs
With the aggregation concluded, MS will now process this information:
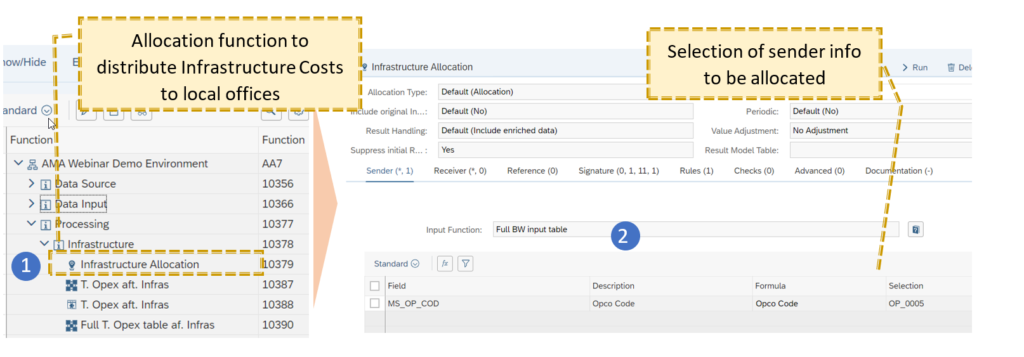
- MS creates a processing functions structure for each phase of the allocation, starting with the infrastructure costs;
- MS defines the input to be used in the allocation (i.e. sender);
- MS defines the rule of allocation. For infrastructure Costs, the defined driver is country’s / office Headcount:


Finally, MS will concatenate this result (i.e. value of infrastructure cost per office) with the resulting table of phase 1, i.e. Full BW input table using a join function. This step will generate a table containing all the relevant information and includes the Infrastructure cost allocated. This last table will then be used as an input for the remaining allocations (IT Service Desk, HR Costs and Admin Expenses).
As these allocations follow the same principle they are not presented in this paper. However, you can see them in our Webinar available online.
Please stay connected to access next week’s fifth part of our Cost allocation / monitoring program Case Study.
We at Stampa & Partners have an extensive track record working with CFOs and supporting organisations in Europe successfully digitalise finance functions, leverage analytics and ensure compliance with new accounting standards. Therefore, we can advise your business with the best solutions to fulfil your goals.
By André Almeida